The top performing student this year can finally catch a break. No more publicity & the unrealistic expectations set by those who “know better” There would also be lesser opportunities for some parents to feel better when comparing their child’s results with their neighbours or ‘friends.’
Why is this so? Now, the score a student can obtain ranges between 4 – 32 instead of 0 – 300. This would be a blessing in disguise as some students will have one less thing to worry about
For those who don’t already know, the aggregate based system is no longer in use. The new system is based on ‘Achievement Level’ ranging from 1-8 where 1 is the best possible score for each subject. This sounds similar to the grade system in O level. However, there are some differences that will make you scratch your head. Before I spill the beans, have a glance at the table below.
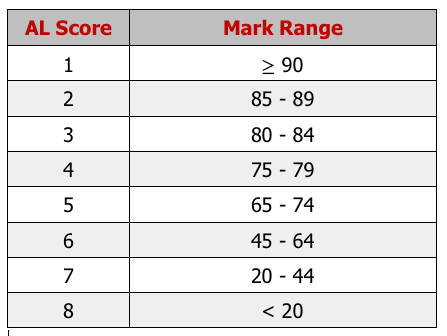
The table above can be found in plenty of websites or just a simple search on Google.
I decided to pry further on the new system & display the scores in a more impartial manner below.
To obtain a grade 5 or above, one needs to score 65% for the subject. The mark range of grade 6 is one of the largest & arguably the most common(45% – 64%)
There are plenty of comparisons we can make to justify why this new system can be ‘prejudiced’ against the common student.
For convenience sake, I promise that I will only use 1 example to justify my thoughts on the new system.
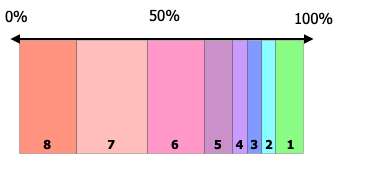
Let’s use 3 students
Student A: 80% (diamond)
Student B: 63% (circle)
Student C: 46% (triangle)
The shapes are plotted on the diagram below to define their score.

By comparing the 3 students, it is clear that student B is exactly in the middle of A & C.
However, Student A scored a 3 while both B & C scored a 6. If we use the same example with the O level system, student B will obtain a grade 4, 3 grades away from both A & C. With this new system, there is no way to tell if your child came close to a grade 5. Two students having a difference of almost 20 marks will not be grade differently, & this will be a huge disadvantage to the student who came close to a grade 5.
In other words, the new system is useful to filter the elites at the top 25% of the population.
Here’s a final tip, GRADES DON’T DEFINE WORTH.
Thank you for reading.
